Confused About Confusion Matrix? Here's What You Need to Know
Lidia Opuchlik
8/5/20226 min read
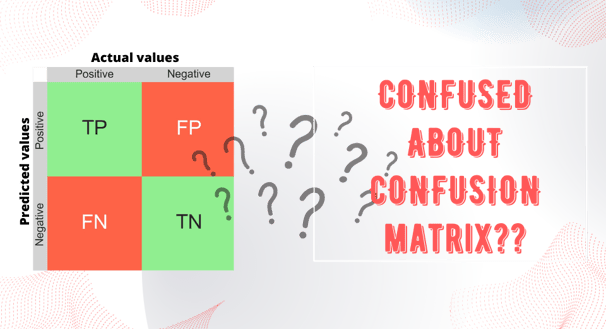
Image by Lidia
Machine learning is a complex field of study. It is difficult to evaluate the performance of machine learning models without a proper evaluation metric. This blog post discusses how to evaluate machine learning models and what metrics are commonly used.
The evaluation metrics are used to measure the performance or quality of machine learning models. They can be classified into two categories: traditional metrics and novel metrics. Traditional metrics are usually used in the context of regression (e. g. RMSE, MAE) or classification (e. g. accuracy, precision, and recall) problems.
Novel metrics are usually used in the context of ranking or clustering problems (e. g. Silhouette score).
This post focuses only on traditional methods of evaluation of classification models. An easy way to evaluate metrics of classification is by using a confusion matrix.
What is a confusion matrix??
a concept/tool used for evaluation of the performance of a classification problem
N by N matrix, where N is the number of possible target classes, e.g. two classes mean the matrix is 2x2, three classes mean the matrix is 3x3, etc.
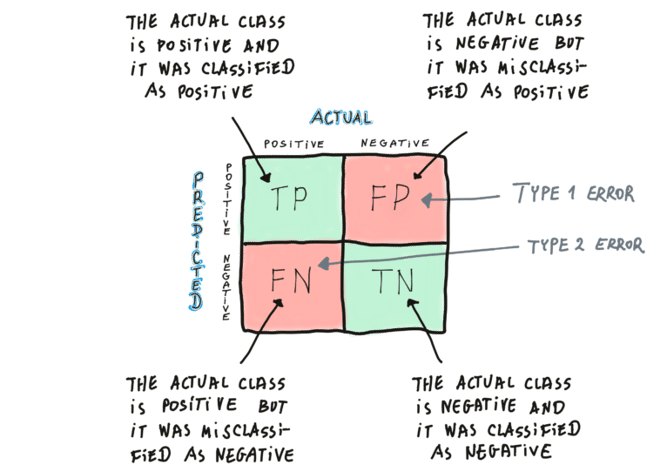
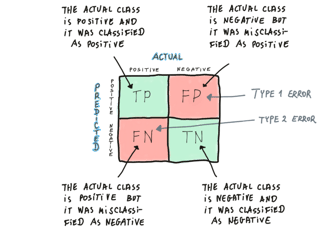
it compares the actual classes with the model outcomes (classes predicted by a model) - it collects observations: TP - true positives, FP - false positives, FN - false negatives, TN - true negatives
it gives an overview of how well the model is performing and what types of errors are made
based on it it is possible to count metrics like: accuracy, precision (positive predicted value), recall, specificity, negative predicted value, f1 score, true positive rate, false positive rate
Intuition behind confusion matrix
Example
Let's say we have 1000 reviews of some book. We want to make a model to evaluate their sentiment - classify them as positive or negative. The data was labelled manually by a human and the true classes are provided - 820 reviews are positive and the remaining 180 are negative. We train the model and the model's outcome is: 700 TP, 120 FN, 100 TN and 80 FP. Calculate the accuracy, precision, recall, specificity and F1 score.
The number of relevant observations is 820 (positive reviews in the initial dataset). But only 700 of those relevant observations were correctly predicted by the model (retrieved). Therefore, the results are roughly 85% complete.
The higher the recall, the better the model is at finding all the relevant examples in the dataset. However, a high recall doesn't necessarily mean that the model is accurate overall, since it could also be identifying negative observations as positives.
It's worth noting that high recall is very desired for medical applications, because, for example, a model characterized by high recall correctly identifies most cases of a disease, ensuring that patients who need treatment receive it.
The last important thing is to visualise the confusion matrix using some digital tool. At the end of the day delivering a story is as much important as all the calculations behind the concept. Python gives us a very convenient and readable solution. With a little help of seaborn, you can draw a very clean confusion matrix.
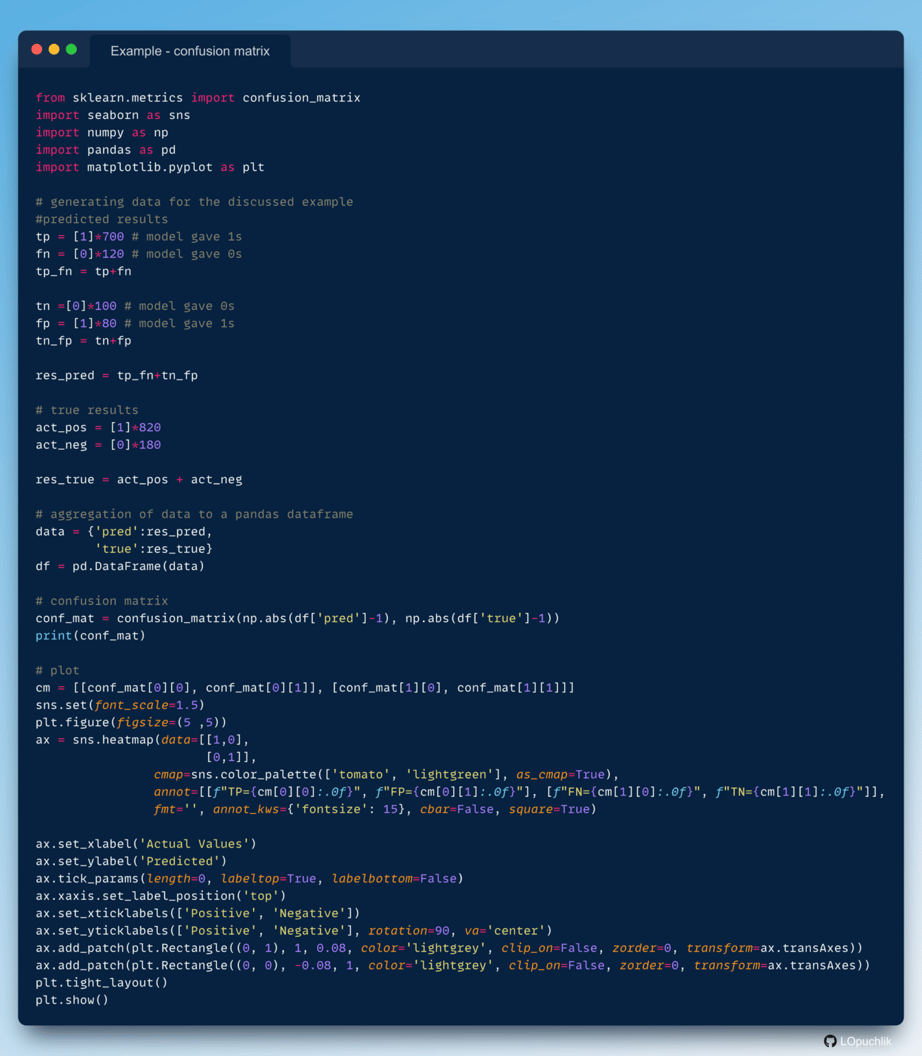
How to make a confusion matrix using python?
The result of the above code is displayed below
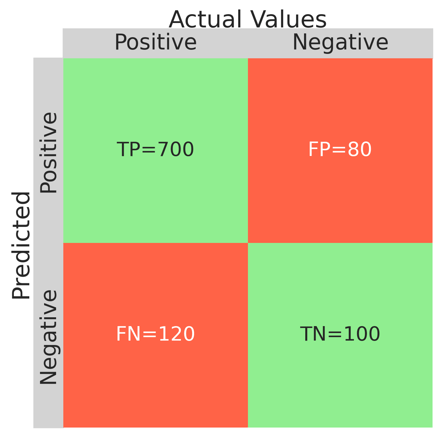
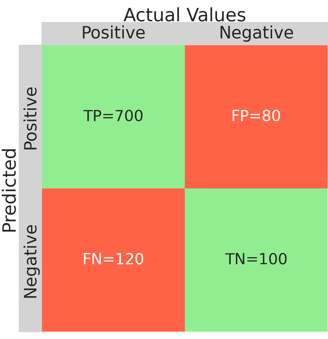
In our example, 700 reviews (TP) out of 820 were classified correctly as positive and 100 (TN) reviews out of 180 were classified correctly as negative. If we calculate the accuracy using the equation, we see that 80 % of outcomes were predicted correctly by the model.
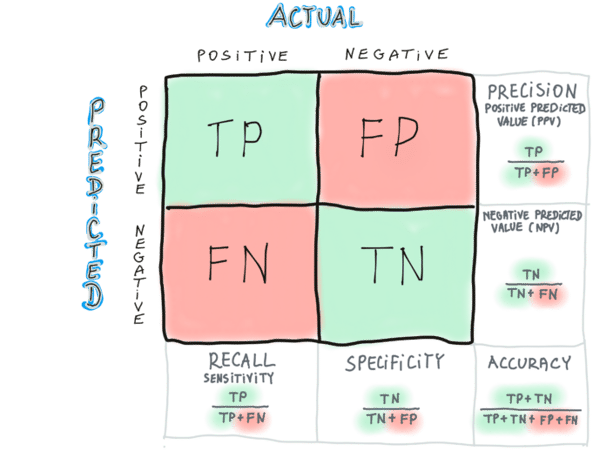
Accuracy
Precision
After performing the calculations, we see that the model is almost 90% precise. It basically means that 9 out of 10 observations that are classified as positive are in fact positive.
A high precision means that the model is good at identifying positive observations, but it doesn't tell us how many positive observations the model missed or how many non-positives it incorrectly identified as positives. When a model has high precision, it means that the model has a low rate of false positives, i.e., it correctly identifies most of the positive examples and has fewer incorrect predictions
Recall
Specificity
In our example, only 100 reviews out of 180 negatives in total were classified as negative. The model only captured slightly over 55% of negative reviews. We can assume that the model is 55% specific.
F1 score
Accuracy tells how many observations out of all observations were classified correctly. Correctly means that the predicted class aligns with the actual class. It basically means that if something was of a positive class it was also predicted as positive (TP), if something was of a negative class, it was classified as negative (TN).
So, accuracy is a way to see how good the program is at telling the difference between one class and the other class, based on how many observations it got right compared to how many it looked at in total.
Precision is another metric that is very useful, maybe even more useful than the previous one. It tells us how many times when a model predicted a positive class, it was right. So it's a ratio of the subset of the truly positive observations (TP), to all the observations that were classified by the model as being true.
In our example, the model classified 780 reviews as positive (according to its judgment). However, only 700 of them are in fact positive and the remaining 80 were classified wrongly by the model as positive - they are called false positives (FP) - because they were falsely classified as positive but they are actually negatives.
Accuracy is pretty easy to understand. However, it works well only with balanced datasets (with a similar number of positive and negative observations). We shouldn't use it for imbalanced datasets.
Next in line is recall - often referred to as sensitivity. Recall reflects the completeness of the predicted results. It reflects the ability of the model to find relevant examples. Basically, how many true positives can be found in the subset of true positives and false negatives (positives which were wrongly classified as negatives). In other words, how many positives were found by the model out of all actual positives that were initially in the dataset (in our case 820).
Precision & recall are often used in combination with other metrics to get a more complete picture of the model's performance. For example, a model with high precision and low recall might correctly identify many of the positive observations but might miss many of them, while a model with high recall and low precision might identify lots of positive observations but also might identify many false positives (i.e., incorrectly identify many of the negatives as positives).
Specificity is a metric used in machine learning to measure how well a model can identify negative examples in a dataset. It's somewhat similar to recall but towards negative observations.
While recall measures a model's ability to identify positive examples (e.g., good reviews in a dataset), then specificity measures a model's ability to identify negative examples (e.g., negative reviews in a dataset).
So, if recall is like playing catch with a friend to make sure you catch all the "good" things (positive examples), then specificity is like playing catch with a friend to make sure you don't catch any of the "bad" things (negative examples).
The F1 score is the harmonic mean of precision and recall, where the maximum score is 1.0 and the worst score is 0.0.
The F1 score is a useful metric for evaluating a model's performance when precision and recall are both important factors to consider. Just to remind you, precision is the proportion of true positive predictions out of all positive predictions, and recall is the proportion of true positive predictions out of all actual positive examples in the dataset.
So, when a model has a high F1 score, it means that it is performing well in both of these aspects. In other words, the model is good at finding all the positive examples in the dataset (high recall) and also good at identifying positive examples (high precision). In our example: